3QFY2016 Result Update | FMCG
May 6, 2016
Procter & Gamble Hygiene & Health Care
BUY
CMP
`6,404
Performance Highlights
Target Price
`7,369
Quarterly Data
Investment Period
12 months
(` cr)
3QFY16
3QFY15
% yoy
2QFY16
% qoq
Revenue
614
555
10.5
714
(14.0)
Stock Info
EBITDA
133
123
8.5
216
(38.3)
Sector
FMCG
Margin (%)
21.7
22.1
(41)
30.3
(857)
Market Cap (` cr)
20,789
Adj. PAT
97
87
12.0
147
(33.7)
Net Debt (` cr)
-619
Source: Company, Angel Research
Beta
0.3
Procter & Gamble Hygiene and Health Care (P&G)’s 3QFY2016 results are
52 Week High / Low
6,981/5,171
broadly in-line with our estimates. For the quarter, the company’s top-line grew
Avg. Daily Volume
4,002
by ~11% yoy to `614cr while the reported PAT grew ~12% yoy to `97cr.
Face Value (`)
10
BSE Sensex
25,262
Key highlights
Nifty
7,736
For 3QFY2016, the company’s top-line grew by ~11% yoy to ~`614cr (against
Reuters Code
PROC.BO
our estimate of ~`624cr), mainly due to growth in both female hygiene and
Bloomberg Code
PG@IN
health care segment. On the operating front, the company reported margin
contraction by 41bp yoy to 21.7%, primarily on account of higher other expenses.
Shareholding Pattern (%)
The reported net profit grew by ~12% yoy to ~`97cr (our estimate was of
Promoters
70.6
~`98cr) on account of healthy sales growth.
MF / Banks / Indian Fls
13.2
FII / NRIs / OCBs
3.8
Outlook and valuation
Indian Public / Others
12.4
On the top-line front, we expect the company to report ~13% CAGR and on the
bottom-line front, we expect ~15% CAGR over FY2015-18E on the back of strong
Abs.(%)
3m
1yr
3yr
brands and distribution network. Further, P&G is a market leader in both of its
Sensex
16.8
(6.4)
28.4
product, ie Whisper (female hygiene segment) and Vicks (healthcare segment-
P&G
2.6
(7.9)
140.1
ointment, creams, cough drops etc). We are positive on the stock and recommend
a Buy rating with a target price of `7,369.
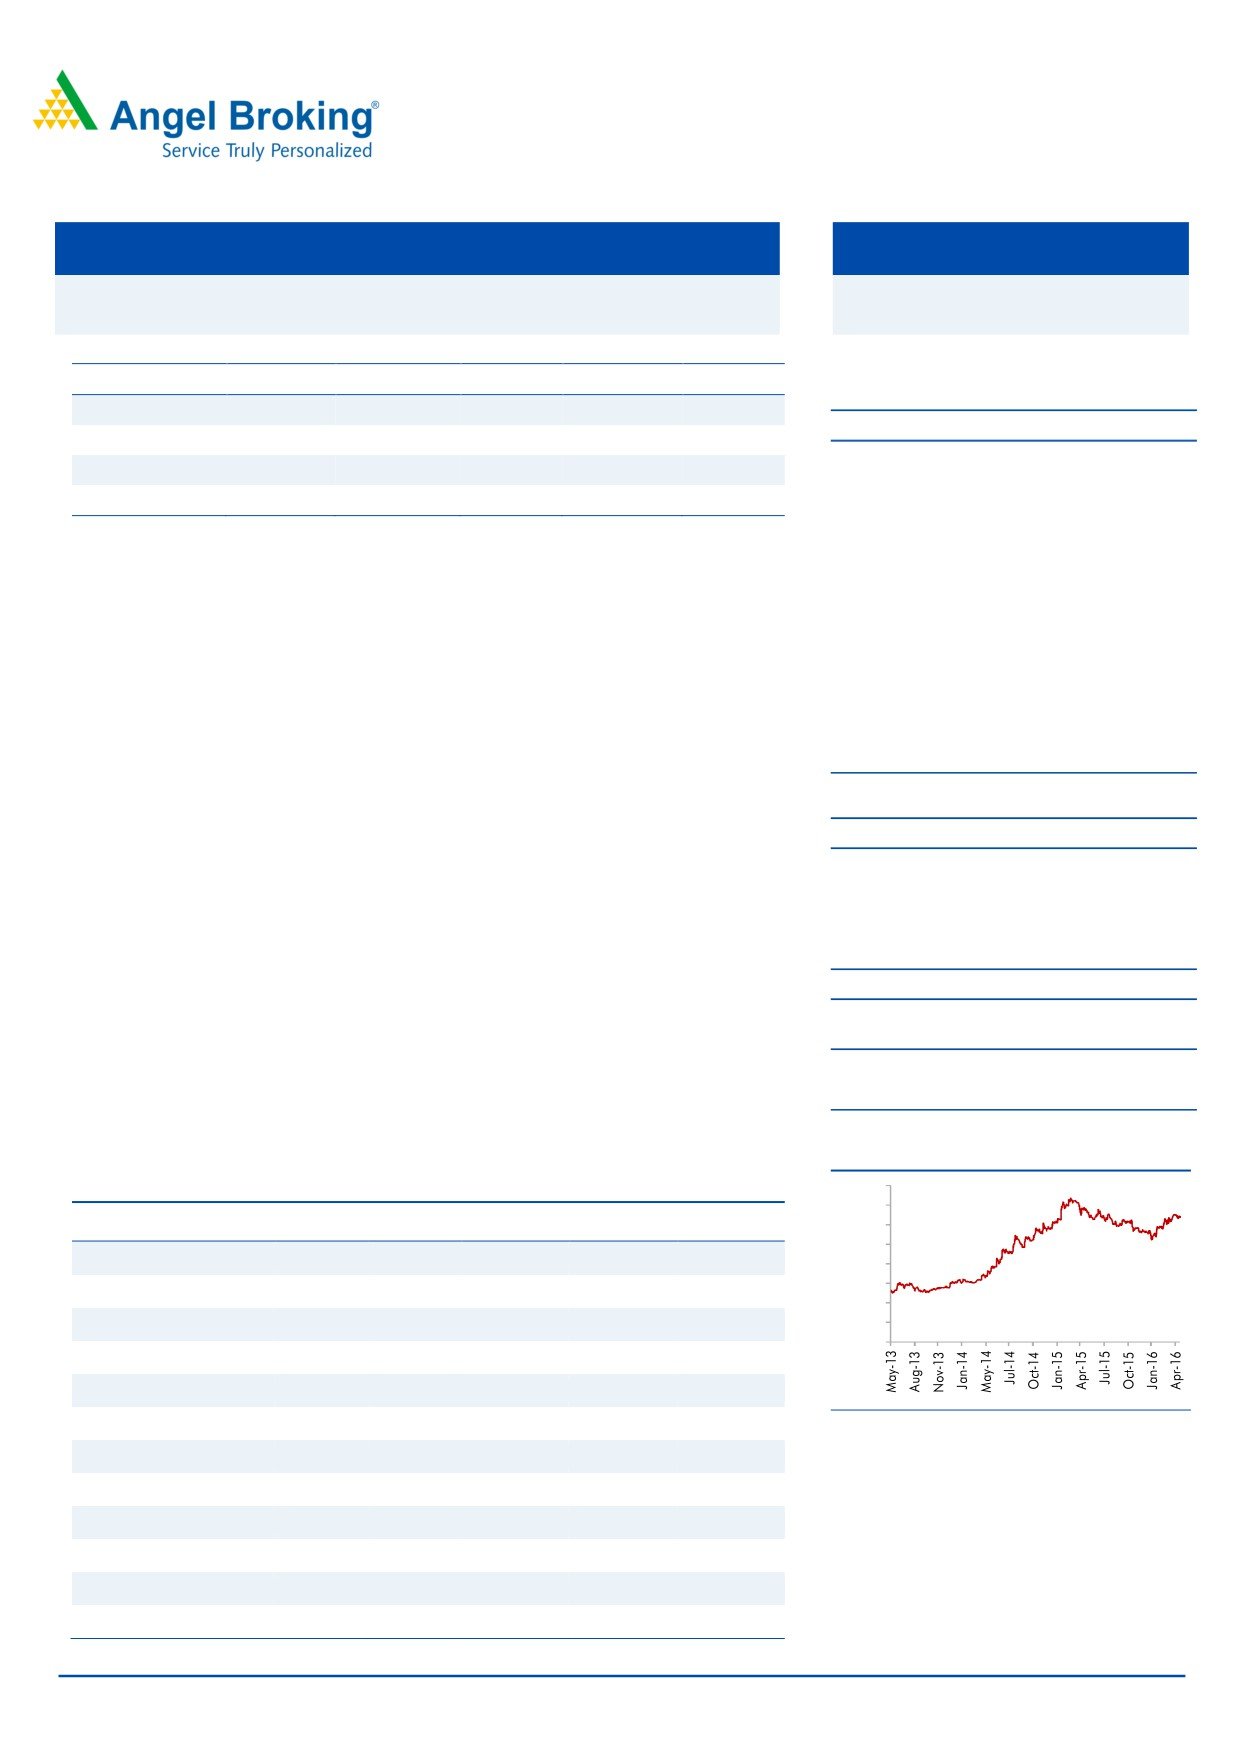
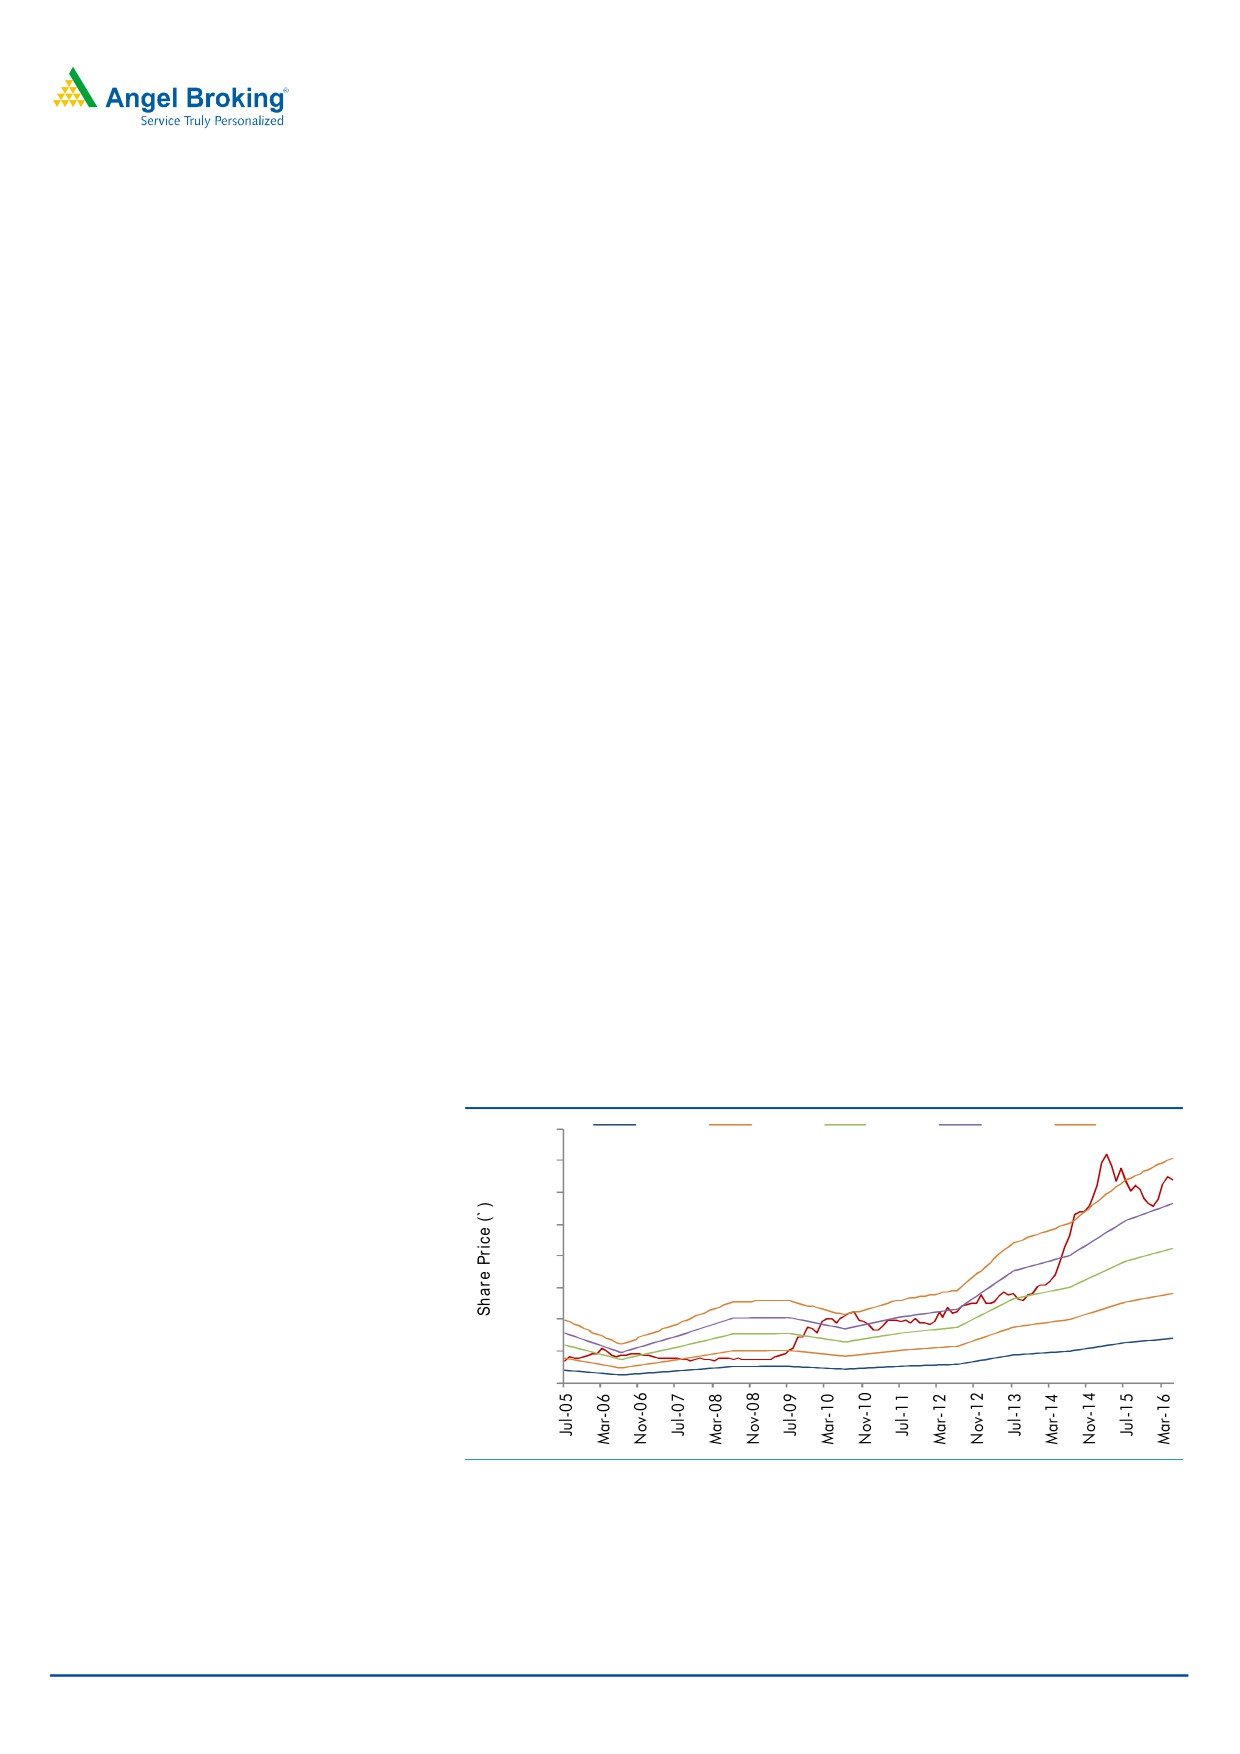
3-year price chart
Key Financials
8000
7000
Y/E June (` cr)
FY2014
FY2015
FY2016E
FY2017E
FY2018E
6000
5000
Net Sales
2,051
2,334
2,588
2,939
3,342
4000
3000
% chg
21.6
13.8
10.9
13.6
13.7
2000
Net Profit
302
346
422
474
531
1000
0
% chg
48.7
14.6
22.1
12.2
12.0
OPM (%)
20.5
20.8
23.3
23.2
23.0
EPS (`)
93.0
106.6
130.2
146.2
163.7
Source: Company, Angel Research
P/E (x)
68.8
60.1
49.2
43.8
39.1
P/BV (x)
20.7
16.9
13.6
11.1
9.2
RoE (%)
30.1
28.1
27.6
25.3
23.5
RoCE (%)
38.4
35.2
35.4
32.9
30.9
Amarjeet S Maurya
EV/Sales (x)
10.0
8.6
7.6
6.6
5.7
022-39357800 Ext: 6831
EV/EBITDA (x)
48.8
41.6
32.6
28.5
25.0
Source: Company, Angel Research; Note: CMP as of May 5, 2016
Please refer to important disclosures at the end of this report
1
Procter & Gamble Hygiene & Health Care | 3QFY2016 Result Update
Exhibit 1: Quarterly performance
Y/E June (` cr)
3QFY16
3QFY15
% yoy
2QFY16
% qoq
9MFY16
9MFY15
% chg
Net Sales
614
555
10.5
714
(14.0)
1,926
1,776
8.4
Consumption of RM
230
224
3.0
268
(14.2)
728
723
0.7
(% of Sales)
37.5
40.3
37.6
37.8
40.7
Staff Costs
26
38
(29.5)
28
(7.0)
89
93
(5.2)
(% of Sales)
4.3
6.8
4.0
4.6
5.3
Ad. & Marketing Expenses
93.05
92.58
0.5
113.89
(18.3)
259
259
(0.0)
(% of Sales)
15.2
16.7
16.0
13.5
14.6
Operating Expense
130.8
79
87.0
405
371
(% of Sales)
21.3
14.2
12.2
21.0
20.9
Total Expenditure
481
432
11.1
498
(3.4)
1,480
1,446
2.3
Operating Profit
133
123
8.5
216
(38.3)
446
330
35.1
OPM (%)
21.7
22.1
30.3
23.2
18.6
Interest
0
4
(93.7)
2
(89.6)
4
5
Depreciation
12
12
1.7
14
(12.8)
39
39
0.2
Other Income
24
18
33.4
21
14.8
65
56
17.2
PBT
144
125
15.8
220
(34.5)
469
341
37.3
Ext Income/(Expense)
-
-
-
PBT (incl. Ext Items)
144.2
125
220.2
469
341
(% of Sales)
23.5
22.4
30.8
24.3
19.2
Provision for Taxation
47
38
24.6
73
(36.1)
155
102
51.4
(% of PBT)
32.5
30.2
33.4
33.0
30.0
Minority Interest
0
0
0
Recurring PAT
97
87
12.0
147
(33.7)
314
239.1
31.3
PATM
15.9
15.6
20.6
16.3
13.5
Exceptional items
0
Reported PAT
97
87
12.0
147
(33.7)
314
239
31.3
Equity shares (cr)
3.2
3.2
3.2
3.2
3.2
FDEPS (`)
30.0
26.8
12.0
45.2
(33.7)
96.7
73.6
31.3
Source: Company, Angel Research
May 6, 2016
2
Procter & Gamble Hygiene & Health Care | 3QFY2016 Result Update
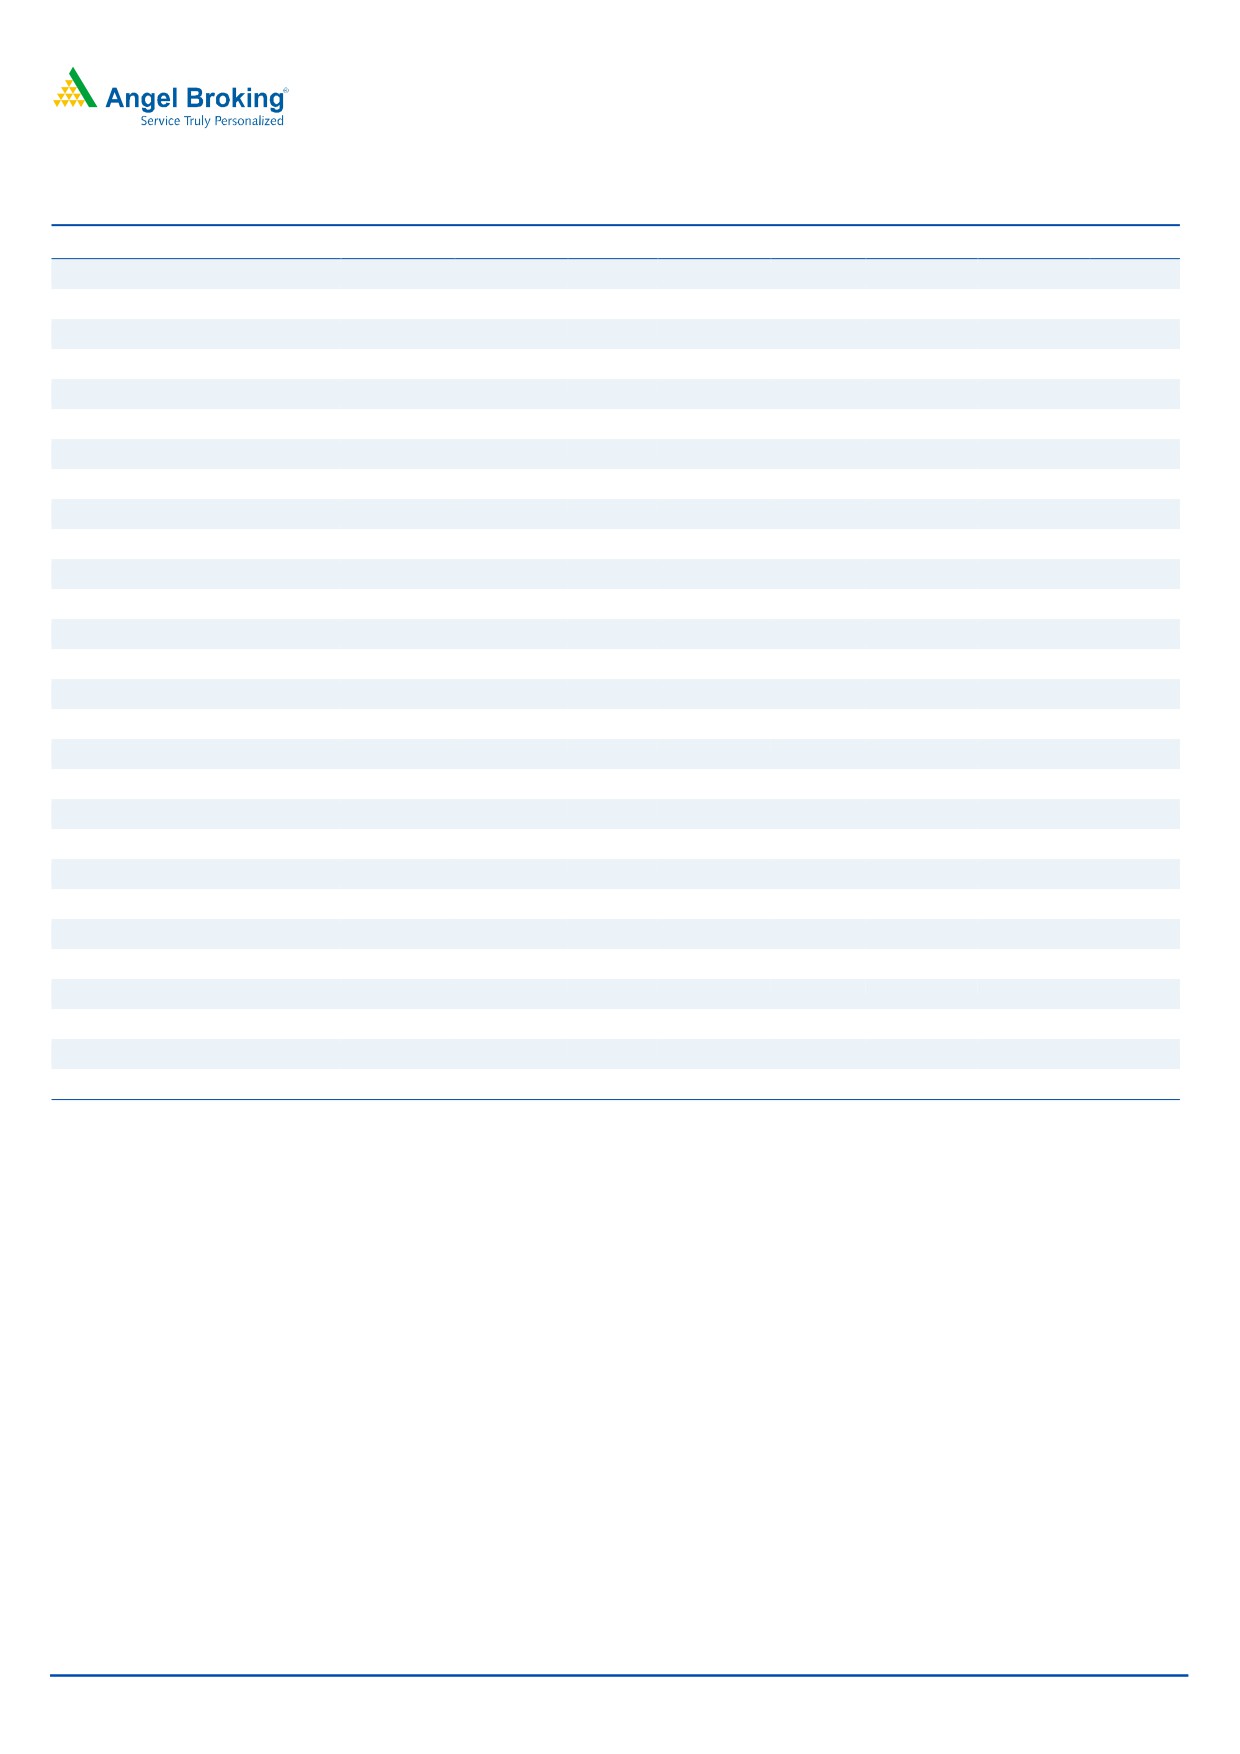
Healthy top-line growth
For 3QFY2016, the company’s top-line grew by ~11% yoy to ~`614cr (against
our estimate of ~`624cr), mainly due to growth in both female hygiene and health
care segment. Going forward we expect the company to continue to perform on
the top-line front due to strong brand positioning, market leadership and wide
distribution network.
Exhibit 2: Top-line growth trend
800
25
700
20
15
600
10
500
5
400
0
300
-5
200
-10
100
-15
0
-20
Net Sales
QoQ growth (%)
Source: Company, Angel Research
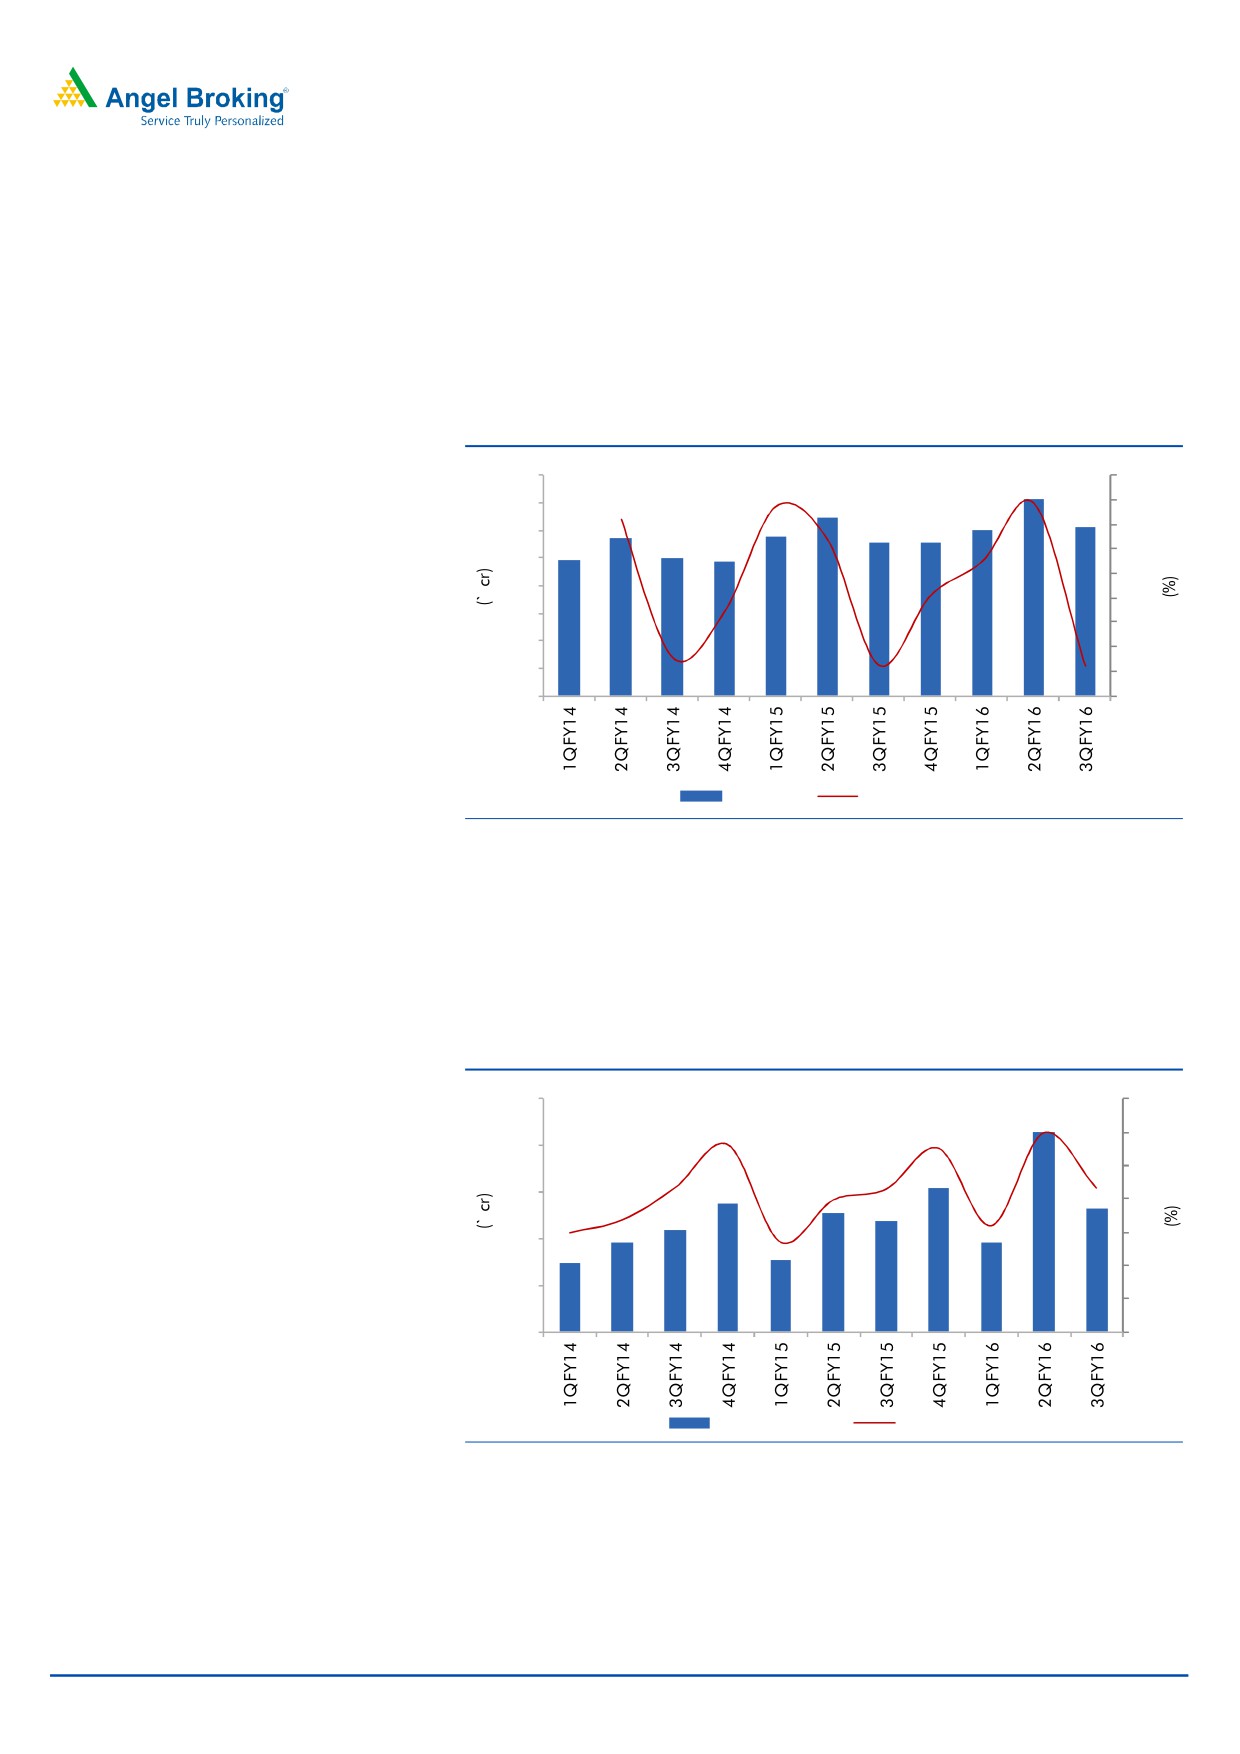
Operating margin contracts due to higher other expenses
On the operating profit front, the company reported growth of 8.5% yoy due to
healthy sales growth. However, the margin contracted by 41bp yoy to 21.7%,
primarily on account of higher other expenses.
Exhibit 3: Operating profit growth trend
250
35
30
200
25
150
20
15
100
10
50
5
0
0
Operating Profit
Margin (%)
Source: Company, Angel Research
May 6, 2016
3
Procter & Gamble Hygiene & Health Care | 3QFY2016 Result Update
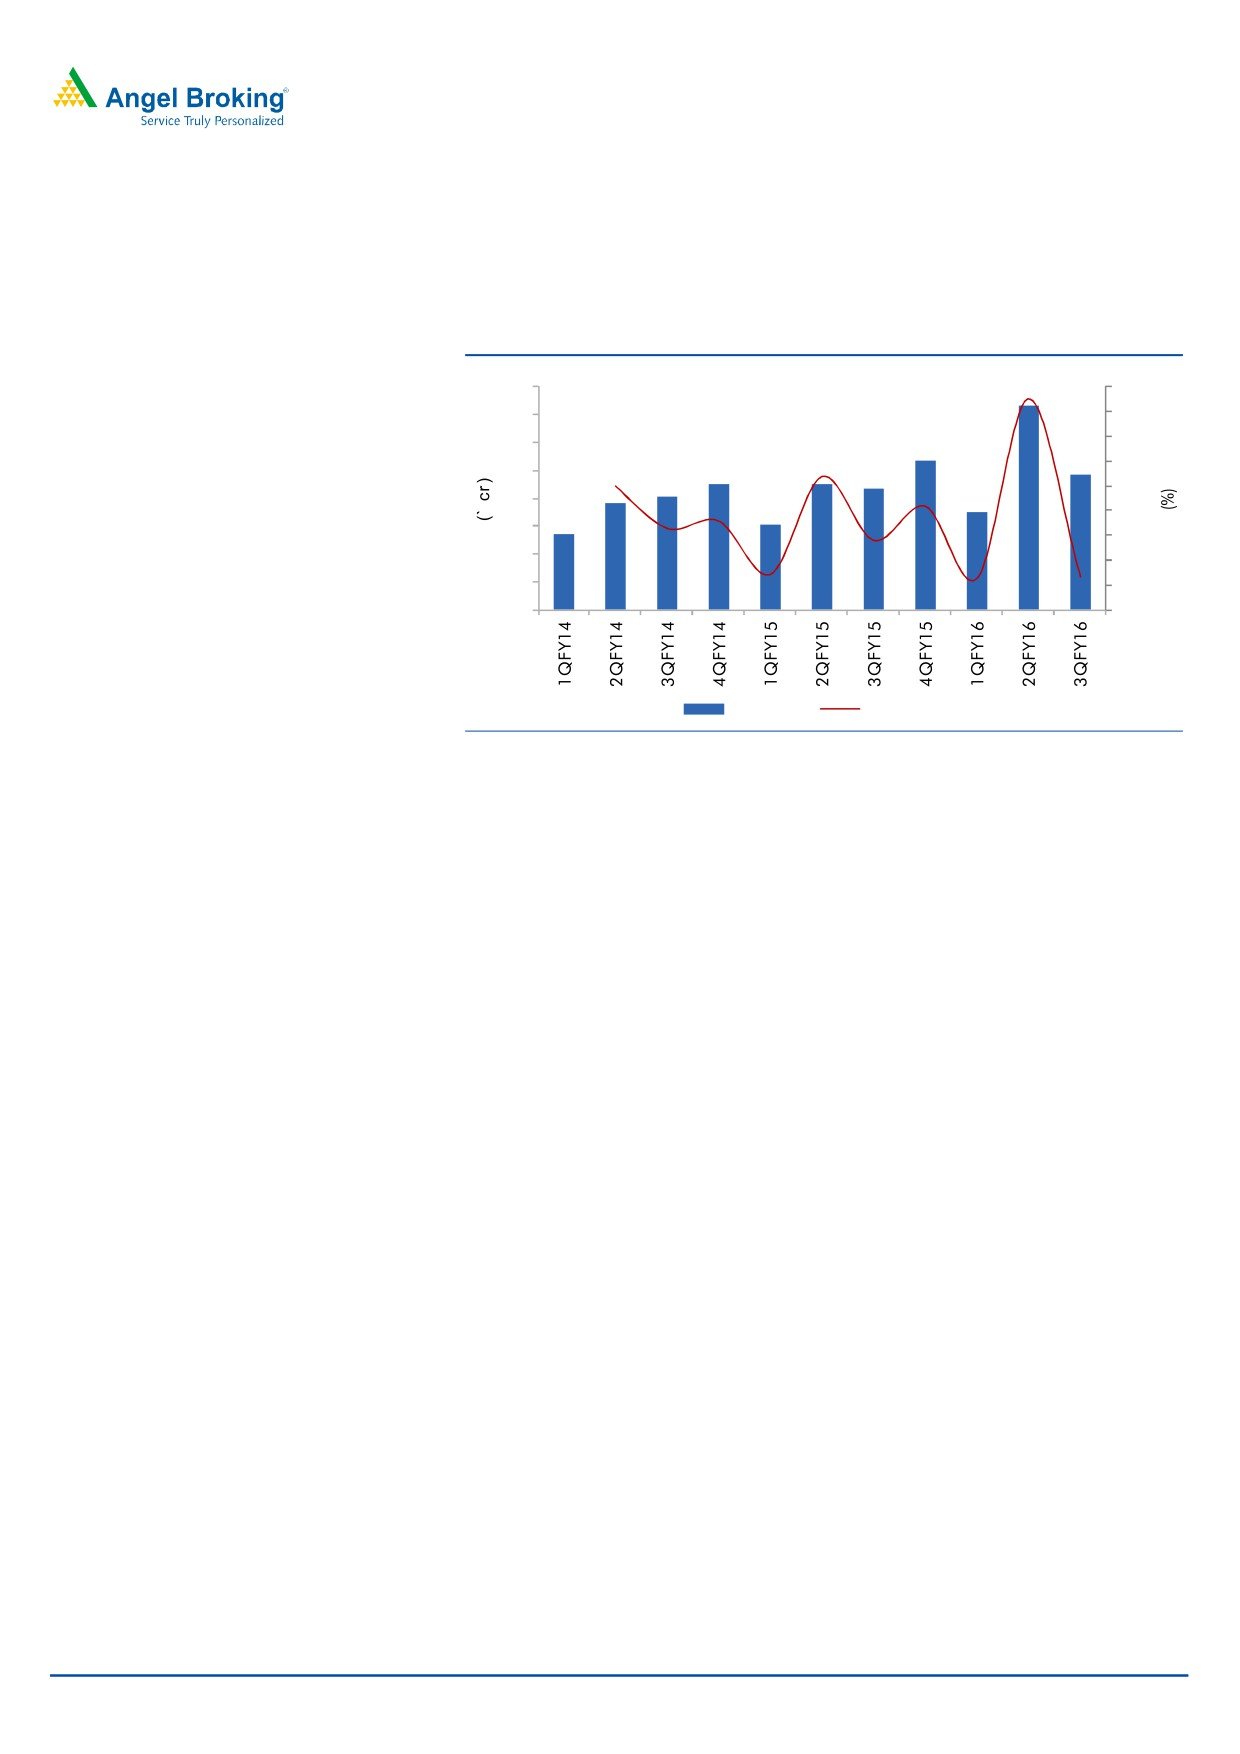
PAT grew ~12%
During the quarter, the company reported net profit growth of ~12% yoy to
~`97cr (our estimate was of ~`98cr) on account of healthy sales growth.
Exhibit 4: Net Profit and growth trend
160
120
140
100
80
120
60
100
40
80
20
60
0
40
-20
20
-40
0
-60
Net Profit
QOQ growth (%)
Source: Company, Angel Research
May 6, 2016
4
Procter & Gamble Hygiene & Health Care | 3QFY2016 Result Update
Investment rationale
Lower penetration in female hygiene segment to drive growth
The current Indian female hygiene market size is of ~`3,400-3,600cr. Over the
last four years, this market has grown at a CAGR of ~30%. We expect the growth
momentum to continue on back of increase in penetration from the current 12%
levels, while it would likely be supported by the government’s campaign to
promote sanitary napkins among adolescent girls. In this space, two brands
capture more than 80% of the market share, with ‘Whisper’, a brand of P&G,
being the leader with a market share of ~47-50%, and the other being Stayfree
from Johnson & Johnson which has a market share of ~35-38%. In our view, P&G
is best placed to benefit from the opportunities arising on the back of rising
disposable incomes and increasing proportion of working women in the country
coupled with its widening distribution reach.
Lower custom duty on raw material to help margin expansion During the Union
Budget FY2016-17, the government has reduced the custom duty on pulp of
wood, a key raw material for P&G, from 5% to 2.5%; and on super absorbent
polymer (used in the manufacture of sanitary pads, napkins and tampons) from
7.5% to 5%. This will be positive for P&G with it having a major presence in female
personal care products.
Outlook and valuation
On the top-line front, we expect the company to report ~13% CAGR and on the
bottom-line front, we expect ~15% CAGR over FY2015-18E on the back of strong
brands and distribution network. Further, P&G is a market leader in both of its
product, ie Whisper (female hygiene segment) and Vicks (healthcare segment-
ointment, creams, cough drops etc). We are positive on the stock and recommend
a Buy rating with a target price of `7,369.
Exhibit 5: One year forward PE band
8 ,000
10.0 X
20.0 X
30.0 X
40.0 X
50.0 X
7 ,000
6 ,000
5 ,000
4 ,000
3 ,000
2 ,000
1 ,000
0
Source: Company, Angel Research
May 6, 2016
5
Procter & Gamble Hygiene & Health Care | 3QFY2016 Result Update
Downside risks to our estimates
P&G has a concentration risk as its revenue is majorly dependent on just two
brands, which is Whisper and Vicks. Although these brands are market leaders in
their respective segments as of now, but any increase in competition could lead to
loss of revenue for the company.
Company Background
Procter & Gamble Hygiene and Health Care Ltd (P&G) is one of India's fastest
growing FMCG companies that has in its portfolio well recognized brands such as
Whisper (69% of revenue) and Vicks (31% of revenue). These brands come under
the company’s feminine care and health care divisions, respectively. The parent
company Procter & Gamble was incorporated on 20th July, 1964 in Mumbai; it
has four regional offices and one plant located at Kundaim in Goa. P&G Hygiene
and Health Care Ltd is a 71% owned subsidiary of Procter & Gamble and
manufactures, distributes and markets two segment leading products Whisper and
Vicks.
May 6, 2016
6
Procter & Gamble Hygiene & Health Care | 3QFY2016 Result Update
Profit & Loss Statement
Y/E June ( ` cr)
FY2014
FY2015
FY2016E
FY2017E
FY2018E
Total operating income
2,051
2,334
2,588
2,939
3,342
% chg
21.6
13.8
10.9
13.6
13.7
Total Expenditure
1,630
1,849
1,985
2,257
2,573
Raw Materials
813
921
983
1,120
1,283
Personnel Expenses
95
113
122
141
167
Selling & Administrative Expenses
398
444
466
520
575
Others Expenses
324
371
414
476
548
EBITDA
421
484
603
682
769
% chg
67.9
15.1
24.5
13.1
12.7
(% of Net Sales)
20.5
20.8
23.3
23.2
23.0
Depreciation& Amortisation
35
53
60
66
71
EBIT
386
432
543
616
697
% chg
75.8
12.0
25.6
13.5
13.2
(% of Net Sales)
18.8
18.5
21.0
21.0
20.9
Interest & other Charges
5
6
6
7
7
Other Income
80
75
76
78
80
(% of PBT)
17.4
14.9
12.4
11.3
10.4
Share in profit of Associates
-
-
-
-
-
Recurring PBT
460
501
613
688
770
% chg
60.8
8.8
22.3
12.2
12.0
Prior Period & Extraord. Exp./(Inc.)
-
-
-
-
-
PBT (reported)
460
501
613
688
770
Tax
158
155
190
213
239
(% of PBT)
34.4
30.9
31.0
31.0
31.0
PAT (reported)
302
346
423
474
532
Add: Share of earnings of asso.
-
-
-
-
-
Less: Minority interest (MI)
0
0
0
0
0
PAT after MI (reported)
302
346
422
474
531
ADJ. PAT
302
346
422
474
531
% chg
48.7
14.6
22.1
12.2
12.0
(% of Net Sales)
14.7
14.8
16.3
16.1
15.9
Basic EPS (`)
93.0
106.6
130.2
146.2
163.7
Fully Diluted EPS (`)
93.0
106.6
130.2
146.2
163.7
% chg
48.6
14.6
22.1
12.2
12.0
May 6, 2016
7
Procter & Gamble Hygiene & Health Care | 3QFY2016 Result Update
Balance Sheet
Y/E June (` cr)
FY2014
FY2015
FY2016E FY2017E FY2018E
SOURCES OF FUNDS
Equity Share Capital
32
32
32
32
32
Reserves& Surplus
970
1,196
1,501
1,842
2,225
Shareholders Funds
1,003
1,229
1,533
1,875
2,257
Total Loans
-
-
-
-
-
Deferred Tax Liability
11
14
14
14
14
Total Liabilities
1,014
1,243
1,548
1,889
2,272
APPLICATION OF FUNDS
Gross Block
428
524
574
624
674
Less: Acc. Depreciation
189
215
275
341
412
Net Block
240
309
298
283
261
Capital Work-in-Progress
98
39
39
39
39
Investments
-
-
-
-
-
Current Assets
1,163
1,596
2,026
2,479
2,990
Inventories
119
119
142
169
192
Sundry Debtors
86
114
135
161
192
Cash
269
619
1,102
1,355
1,603
Loans & Advances
539
506
388
441
535
Other Assets
151
239
259
353
468
Current liabilities
505
719
834
930
1,037
Net Current Assets
658
877
1,192
1,549
1,953
Deferred Tax Asset
18
18
18
18
18
Total Assets
1,014
1,243
1,548
1,889
2,272
May 6, 2016
8
Procter & Gamble Hygiene & Health Care | 3QFY2016 Result Update
Cashflow Statement
Y/E June (` cr)
FY2014
FY2015
FY2016E FY2017E FY2018E
Profit before tax
460
501
613
688
770
Depreciation
35
53
60
66
71
Change in Working Capital
9
123
169
(104)
(156)
Interest / Dividend (Net)
(61)
(66)
(6)
(7)
(7)
Direct taxes paid
(111)
(206)
(190)
(213)
(239)
Others
3
21
-
-
-
Cash Flow from Operations
335
426
646
429
440
(Inc.)/ Dec. in Fixed Assets
(135)
28
(50)
(50)
(50)
(Inc.)/ Dec. in Investments
-
-
-
-
-
Cash Flow from Investing
(135)
28
(50)
(50)
(50)
Issue of Equity
-
-
-
-
-
Inc./(Dec.) in loans
(16)
(14)
-
-
-
Dividend Paid (Incl. Tax)
(81)
(89)
(118)
(133)
(149)
Interest / Dividend (Net)
(0)
(1)
6
7
7
Cash Flow from Financing
(97)
(104)
(112)
(126)
(142)
Inc./(Dec.) in Cash
103
350
484
253
248
Opening Cash balances
166
269
619
1,102
1,355
Closing Cash balances
269
619
1,102
1,355
1,603
May 6, 2016
9
Procter & Gamble Hygiene & Health Care | 3QFY2016 Result Update
Key ratios
Y/E June
FY2014
FY2015E FY2016E FY2017E FY2018E
Valuation Ratio (x)
P/E (on FDEPS)
68.8
60.1
49.2
43.8
39.1
P/CEPS
61.6
52.1
43.0
38.5
34.5
P/BV
20.7
16.9
13.6
11.1
9.2
Dividend yield (%)
0.4
0.5
0.6
0.6
0.7
EV/Sales
10.0
8.6
7.6
6.6
5.7
EV/EBITDA
48.8
41.6
32.6
28.5
25.0
EV / Total Assets
13.5
10.3
8.3
6.9
5.8
Per Share Data (`)
EPS (Basic)
93.0
106.6
130.2
146.2
163.7
EPS (fully diluted)
93.0
106.6
130.2
146.2
163.7
Cash EPS
103.9
122.8
148.8
166.4
185.7
DPS
27.5
30.2
36.5
40.9
45.8
Book Value
309.0
378.5
472.3
577.5
695.4
Returns (%)
ROCE
38.4
35.2
35.4
32.9
30.9
Angel ROIC (Pre-tax)
52.5
70.8
126.0
118.6
106.6
ROE
30.1
28.1
27.6
25.3
23.5
Turnover ratios (x)
Asset Turnover (Gross Block)
4.8
4.5
4.5
4.7
5.0
Inventory / Sales (days)
21
19
20
21
21
Receivables (days)
15
18
19
20
21
Payables (days)
42
59
60
58
56
WC cycle (ex-cash) (days)
(6)
(23)
(21)
(17)
(14)
May 6, 2016
10
Procter & Gamble Hygiene & Health Care | 3QFY2016 Result Update
Research Team Tel: 022 - 39357800
DISCLAIMER
Angel Broking Private Limited (hereinafter referred to as “Angel”) is a registered Member of National Stock Exchange of India Limited,
Bombay Stock Exchange Limited and Metropolitan Stock Exchange of India Limited. It is also registered as a Depository Participant with
CDSL and Portfolio Manager with SEBI. It also has registration with AMFI as a Mutual Fund Distributor. Angel Broking Private Limited is
a registered entity with SEBI for Research Analyst in terms of SEBI (Research Analyst) Regulations, 2014 vide registration number
INH000000164. Angel or its associates has not been debarred/ suspended by SEBI or any other regulatory authority for accessing
/dealing in securities Market. Angel or its associates including its relatives/analyst do not hold any financial interest/beneficial
ownership of more than 1% in the company covered by Analyst. Angel or its associates/analyst has not received any compensation /
managed or co-managed public offering of securities of the company covered by Analyst during the past twelve months. Angel/analyst
has not served as an officer, director or employee of company covered by Analyst and has not been engaged in market making activity
of the company covered by Analyst.
This document is solely for the personal information of the recipient, and must not be singularly used as the basis of any investment
decision. Nothing in this document should be construed as investment or financial advice. Each recipient of this document should
make such investigations as they deem necessary to arrive at an independent evaluation of an investment in the securities of the
companies referred to in this document (including the merits and risks involved), and should consult their own advisors to determine
the merits and risks of such an investment.
Reports based on technical and derivative analysis center on studying charts of a stock's price movement, outstanding positions and
trading volume, as opposed to focusing on a company's fundamentals and, as such, may not match with a report on a company's
fundamentals.
The information in this document has been printed on the basis of publicly available information, internal data and other reliable
sources believed to be true, but we do not represent that it is accurate or complete and it should not be relied on as such, as this
document is for general guidance only. Angel Broking Pvt. Limited or any of its affiliates/ group companies shall not be in any way
responsible for any loss or damage that may arise to any person from any inadvertent error in the information contained in this report.
Angel Broking Pvt. Limited has not independently verified all the information contained within this document. Accordingly, we cannot
testify, nor make any representation or warranty, express or implied, to the accuracy, contents or data contained within this document.
While Angel Broking Pvt. Limited endeavors to update on a reasonable basis the information discussed in this material, there may be
regulatory, compliance, or other reasons that prevent us from doing so.
This document is being supplied to you solely for your information, and its contents, information or data may not be reproduced,
redistributed or passed on, directly or indirectly.
Neither Angel Broking Pvt. Limited, nor its directors, employees or affiliates shall be liable for any loss or damage that may arise from
or in connection with the use of this information.
Note: Please refer to the important ‘Stock Holding Disclosure' report on the Angel website (Research Section). Also, please refer to the
latest update on respective stocks for the disclosure status in respect of those stocks. Angel Broking Pvt. Limited and its affiliates may
have investment positions in the stocks recommended in this report.
Disclosure of Interest Statement
Procter & Gamble Hygiene & Health Care
1. Analyst ownership of the stock
No
2. Angel and its Group companies ownership of the stock
No
3. Angel and its Group companies' Directors ownership of the stock
No
4. Broking relationship with company covered
No
Note: We have not considered any Exposure below ` 1 lakh for Angel, its Group companies and Directors
Ratings (Based on expected returns
Buy (> 15%)
Accumulate (5% to 15%)
Neutral (-5 to 5%)
over 12 months investment period):
Reduce (-5% to -15%)
Sell (< -15%)
May 6, 2016
11